File:LOD Cloud Diagram as of September 2011.svg
Jump to navigation
Jump to search

Size of this PNG preview of this SVG file: 512 × 335 pixels. Other resolutions: 320 × 209 pixels | 640 × 419 pixels | 1,024 × 670 pixels | 1,280 × 838 pixels | 2,560 × 1,675 pixels.
Original file (SVG file, nominally 512 × 335 pixels, file size: 202 KB)
Summary
| Description |
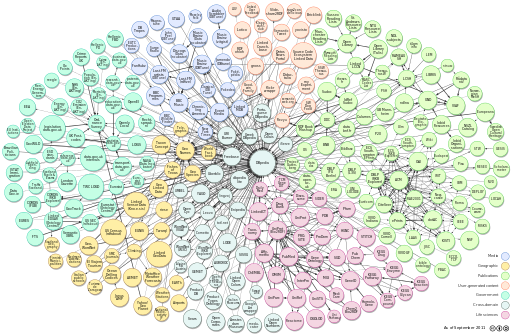
English: The following diagram visualizes the data sets in the LOD cloud as well as their interlinkage relationships. Each node in this cloud diagram represents a distinct data set published as Linked Data. The arcs indicate that RDF links exist between items in the two connected data sets. Heavier arcs roughly correspond to a greater number of links between two data sets, while bidirectional arcs indicate the outward links to the other exist in each data set. |
| Date | |
| Source | http://richard.cyganiak.de/2007/10/lod/ |
| Author |
Richard Cyganiak Anja Jentzsch |
| Other versions | File:LOD_Cloud_Diagram_as_of_September_2011.png, update: File:LOD Cloud 2014.svg |
Licensing
I, the copyright holder of this work, hereby publish it under the following license:
This file is licensed under the Creative Commons Attribution-Share Alike 3.0 Unported license.
- You are free:
- to share – to copy, distribute and transmit the work
- to remix – to adapt the work
- Under the following conditions:
- attribution – You must give appropriate credit, provide a link to the license, and indicate if changes were made. You may do so in any reasonable manner, but not in any way that suggests the licensor endorses you or your use.
- share alike – If you remix, transform, or build upon the material, you must distribute your contributions under the same or compatible license as the original.
File history
Click on a date/time to view the file as it appeared at that time.
| Date/Time | Thumbnail | Dimensions | User | Comment | |
|---|---|---|---|---|---|
| current | 21:23, 24 March 2013 | | 512 × 335 (202 KB) | Patrick87 | Optimized even further |
| 14:07, 24 March 2013 |  | 512 × 335 (338 KB) | Patrick87 | Optimize SVG a bit | |
| 13:25, 24 March 2013 |  | 512 × 335 (426 KB) | Patrick87 | Fixed rendering again (starting from original file) | |
| 14:41, 17 February 2013 |  | 1,675 × 1,096 (261 KB) | AnonMoos | last time | |
| 14:37, 17 February 2013 |  | 1,675 × 1,096 (261 KB) | AnonMoos | try again | |
| 14:25, 17 February 2013 |  | 1,675 × 1,096 (261 KB) | AnonMoos | fixes | |
| 14:18, 11 February 2013 |  | 512 × 335 (261 KB) | Pyfisch | {{Information |Description ={{en|1=The following diagram visualizes the data sets in the LOD cloud as well as their interlinkage relationships. Each node in this cloud diagram represents a distinct data set published as Linked Data. The arcs indicat... |
File usage
The following page uses this file:
Global file usage
The following other wikis use this file:
- Usage on sv.wikipedia.org